At Weetech, we have spent years helping businesses transform their digital presence through strategic web performance optimization. Our team has analyzed thousands of websites, identifying the exact bottlenecks that slow down loading times and frustrate users.
Website speed is not just a technical metric, it is a business imperative. Every second of delay costs you real money. Studies consistently show that users abandon sites that take longer than three seconds to load. You are not just losing visitors; you are losing potential customers, revenue and market share to faster competitors.
Google understands this reality. That is why they have made Core Web Vitals a crucial ranking factor in their search algorithm. Your sites performance directly impacts where you appear in search results. If your pages load slowly, you are fighting an uphill battle for visibility, regardless of how great your content is.
The good news? You can dramatically improve your website speed with the right strategies. Our web performance team has distilled years of optimization experience into seven actionable tips that deliver measurable results. These are not theoretical concepts they are proven techniques we use daily to boost website speed for clients across industries. You will learn how to analyze performance data, prioritize critical content and implement monitoring systems that keep your site running at peak efficiency.
Table of Contents
- Understanding Website Speed and Its Impact
- The Need for Constant Attention to Site Speed
- Analyze a Network Request Waterfall for Detailed Insights
- Prioritize Loading of Critical Content
- Reduce Download Sizes of Key Early Requests
- Compare Real User Data with Lab Data for Accurate Performance Assessment
- Monitor Website Performance Trends Over Time
- Set Up Continuous Website Speed Monitoring Systems
- Expand Focus Beyond Load Time Metrics to Responsiveness Metrics
Understanding Website Speed and Its Impact
Website speed impact goes beyond just load times. When your site loads in under three seconds, you will see visitor engagement rates climb by up to 70%. Users who experience fast-loading pages spend more time browsing, view more products and complete purchases at significantly higher rates. A one-second delay in page response can reduce conversion rates by 7%, leading to significant revenue loss for businesses of all sizes.
The Importance of Google’s Core Web Vitals
Google’s Core Web Vitals are essential for measuring user experience through three specific metrics:
- Time to First Byte (TTFB): Measures server response time the moment your server begins sending data to the browser
- First Contentful Paint (FCP): Tracks when the first piece of content becomes visible to users
- Largest Contentful Paint (LCP): Identifies when the main content element fully renders on screen
These metrics directly affect your search rankings. Google’s algorithm prioritizes websites that deliver superior performance, meaning slow sites get pushed down in search results regardless of content quality.
The Need for Constant Attention to Site Speed
The competitive landscape requires ongoing focus on site speed. Your competitors are currently optimizing their performance. Search algorithms are constantly evolving, raising the standards for acceptable performance.
Regular monitoring and optimization are not optional tasks they are crucial practices for maintaining visibility, protecting revenue streams and supporting sustainable business growth. Sites that ignore speed optimization will lose both search rankings and customer trust at the same time.
1. Analyze a Network Request Waterfall for Detailed Insights
A network request waterfall is a visual timeline that displays every resource your website downloads from HTML documents and CSS files to images and JavaScript. Think of it as a detailed roadmap showing when each element starts loading, how long it takes and what might be blocking other resources from loading.

You can access this powerful diagnostic tool through Google PageSpeed Insights or GTmetrix. When you run a test, the waterfall chart reveals critical performance milestones:
- Time to First Byte (TTFB): The moment your server responds with the first byte of data
- First Contentful Paint (FCP): When the first piece of content appears on screen
- Largest Contentful Paint (LCP): When the largest visible element finishes loading
The real value comes from identifying render-blocking resources those CSS and JavaScript files that prevent your page from displaying content. These appear as long horizontal bars at the top of your waterfall, delaying everything else.
Look for requests with extended connection times or slow server responses. If you see multiple requests queuing up, your server might be limiting concurrent connections. You can optimize these by:
- Reducing the number of third-party scripts
- Implementing resource hints like preconnect for external domains
- Upgrading your hosting infrastructure
- Enabling HTTP/2 or HTTP/3 for multiplexed connections
The waterfall does not lie it shows you exactly where your website loses precious milliseconds that could cost you conversions.
2. Prioritize Loading of Critical Content
Your website visitors form their first impression within milliseconds. Critical content loading determines whether users see a blank screen or meaningful content during those crucial initial moments. The human brain perceives websites that display important elements immediately as faster, even if the total load time remains identical.
➢ Strategic Loading Techniques for Speed Perception
You need to identify which elements matter most for your above-the-fold content. Your hero image, headline and primary call-to-action button deserve priority treatment. Here’s how to ensure they load first:
- Avoid lazy loading exceptions: Remove lazy loading attributes from images that appear in the viewport immediately. Lazy loading works brilliantly for below-the-fold content, but applying it to your hero image creates unnecessary delays.
- Implement the fetchpriority attribute: Add fetchpriority=”high” to your most important images. This HTML attribute tells browsers to prioritize these resources over less critical ones. Your Largest Contentful Paint (LCP) element should always receive this treatment.
- Use preload tags strategically: Insert tags in your HTML head for critical resources like hero images, essential fonts or key CSS files. This technique instructs browsers to fetch these assets immediately, before the browser would naturally discover them during parsing.
The difference between a well-optimized site and a slow one often comes down to loading sequence rather than total file size. You control what loads first and that control directly impacts how users perceive your site’s performance.
Also Read: How to use SEO Proxies to Improve your Website’s Rankings
3. Reduce Download Sizes of Key Early Requests
Large files create a significant bottleneck in your website’s loading process. When your browser needs to download a 2MB image before rendering your hero section, you’re forcing users to wait unnecessarily. File size reduction directly translates to faster load times and improved Core Web Vitals scores.

➢ Use Modern Image Formats
Modern image formats deliver the same visual quality at a fraction of the file size. WebP typically reduces image sizes by 25-35% compared to JPEG while Avif pushes this even further with 30-50% smaller files. You’ll see dramatic improvements in LCP when you convert your hero images and above-the-fold graphics to these formats.
➢ Enable Brotli Compression
Text-based resources benefit enormously from Brotli compression. This algorithm compresses HTML, CSS and JavaScript files more efficiently than traditional gzip, often achieving 15-20% better compression ratios. Your server can enable Brotli with minimal configuration changes.
➢ Implement Efficient HTML/CSS Practices
Efficient HTML/CSS practices amplify these gains:
- Remove unused CSS rules that bloat your stylesheets
- Eliminate embedded Base64 images from your HTML
- Strip unnecessary web fonts and font weights
- Minify all text resources to remove whitespace and comments
You should audit your critical rendering path resources first. The files loaded in the first 2-3 seconds matter most. A 500KB reduction in your initial payload can improve FCP by 0.5-1 second on 3G connections, directly impacting user engagement and conversion rates.
4. Compare Real User Data with Lab Data for Accurate Performance Assessment
Lab testing tools give you controlled, repeatable results in perfect conditions. Real user data analysis tells you what is actually happening when people visit your site from different devices, networks and locations. You need both perspectives to understand your website’s true performance.
Google PageSpeed Insights provides both types of data in a single interface. The lab data section shows metrics from Lighthouse tests these run in a controlled Chrome environment with simulated network conditions. Scroll down to the “Discover what your real users are experiencing” section and you will see Field Data from the Chrome User Experience Report (CrUX). This reflects actual visitor experiences over the past 28 days.
The gap between these two datasets can be revealing:
- Lab tests might show a 2-second LCP while real users experience 4+ second
- Your controlled test environment does not account for slow mobile networks or older devices
- Real user data captures the full spectrum of connection speeds and hardware capabilities
You should prioritize fixing issues that appear in both datasets first. When real user metrics significantly lag behind lab results, investigate device-specific problems or regional network constraints. Use the CrUX data breakdown by device type and connection speed to identify which user segments struggle most with your site’s performance.
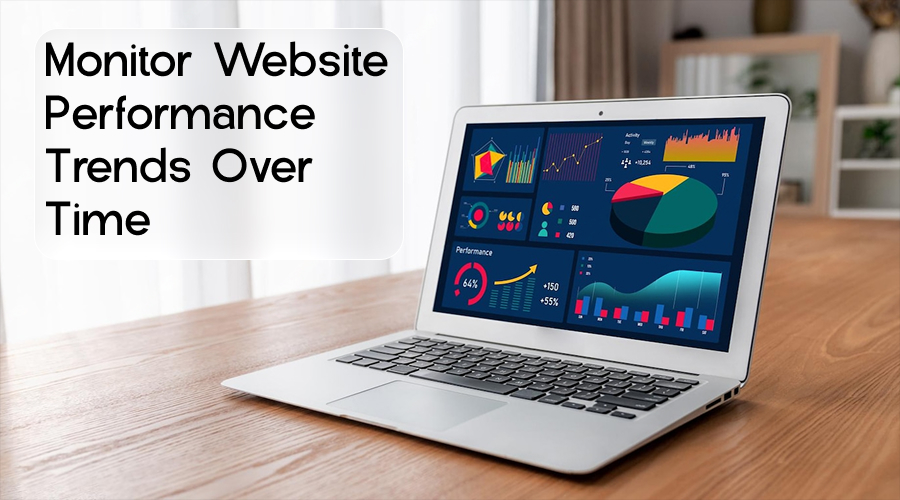
5. Monitor Website Performance Trends Over Time

You cannot fix what you do not measure consistently. Performance trend analysis turns individual speed tests into valuable insights about your website’s health.
Tracking your site’s speed metrics over weeks and months reveals patterns that single tests miss. You might notice gradual slowdowns after plugin updates, seasonal traffic spikes affecting server response times or improvements following optimization efforts. This historical perspective separates temporary fluctuations from genuine performance issues requiring immediate attention.
Historical Core Web Vitals data serves as your diagnostic timeline. When your LCP suddenly jumps from 2.1 seconds to 3.8 seconds, you need to know exactly when this degradation occurred. Was it after:
- A recent code deployment?
- A third-party script update?
- Changes to your hosting infrastructure?
- New content additions or media uploads?
By correlating performance drops with specific dates and events, you identify root causes faster. You will spot whether that new image carousel introduced in March caused your FCP to deteriorate or if switching CDN providers in April improved your TTFB across all pages.
The data tells a story. A three-month trend showing consistent INP improvements validates your JavaScript optimization strategy. A sudden spike in CLS last Tuesday points to a specific change worth investigating. You are not guessing you are making informed decisions based on concrete evidence from our Boost Website Speed: 7 Tips from Our Web Performance Team approach.
6. Set Up Continuous Website Speed Monitoring Systems
Tracking performance trends reveals patterns, but continuous monitoring systems catch issues the moment they occur. You need automated systems that alert you to performance degradations before they impact your rankings or revenue.
1. Lab-based testing
Lab-based testing provides controlled, synthetic measurements of your site’s performance. These tests run from specific locations using predefined network conditions, giving you consistent baseline data. You can schedule these tests to run hourly or daily, creating a safety net that catches regressions immediately after deployments.
Real-user monitoring (RUM) captures actual visitor experiences across different devices, browsers and network conditions. This approach collects performance data from real users as they navigate your site, revealing issues that synthetic tests might miss. You will see exactly how your site performs for users on slow mobile connections in rural areas versus those on high-speed fiber connections.
3. Regression detection
Regression detection acts as your early warning system. When you deploy new code, add plugins or update themes, these systems compare current performance against historical baselines. You will receive alerts when metrics degrade beyond acceptable thresholds, allowing you to roll back changes before users notice problems.
The combination of these three monitoring strategies creates a comprehensive safety net. Lab tests catch obvious issues, RUM reveals real-world problems and regression detection prevents performance from slowly degrading over time.
7. Expand Focus Beyond Load Time Metrics to Responsiveness Metrics
Your website might load quickly, but that does not guarantee a smooth user experience. Largest Contentful Paint (LCP) tells you when your main content appears, yet it reveals nothing about how your site responds when users click buttons, fill forms or navigate menus.
Interaction to Next Paint (INP) measures the time between a user’s action and the visual response on screen. Think of it this way: a user clicks “Add to Cart” on your e-commerce site. INP tracks how long they wait before seeing confirmation that their action registered. High INP values create frustration users click multiple times, abandon carts or leave your site entirely.
Responsiveness metrics capture the interactive experience that load time metrics miss:
- INP – Measures delay from user interactions to visual feedback
- First Input Delay (FID) – Tracks the initial interaction responsiveness
- Total Blocking Time (TBT) – Identifies how long your page remains unresponsive during loading
Real user monitoring becomes essential for improving these metrics. Lab tests cannot replicate the diverse ways actual visitors interact with your site their device capabilities, network conditions and interaction patterns vary dramatically. You need data from real users clicking, scrolling and typing on your site to identify where responsiveness breaks down and prioritize fixes that matter most to your audience.
Also Read: Key Differences Between INP vs FID
Conclusion
Website speed is not a one-time fix it is an ongoing commitment to your users and your business success. These 7 tips from our web performance team give you a comprehensive roadmap for sustainable website optimization that drives real results.
You have learned how to:
- Analyze network waterfalls to identify bottlenecks
- Prioritize critical content loading
- Reduce file sizes strategically
- Compare lab and real user data
- Monitor performance trends
- Set up continuous monitoring systems
- Track responsiveness metrics beyond load time
Implementing these strategies will boost website speed, improve your Core Web Vitals scores and create a faster, more engaging experience for your visitors. The impact on your SEO rankings and conversion rates can be substantial.
Ready to take your website performance to the next level? Our team at Weetech specializes in professional web performance optimization services tailored to your specific needs. We will help you identify opportunities, implement solutions and maintain peak performance over time. Reach out to us today to discuss how we can accelerate your website’s success.


